Workplace safety: record the violation and send the alert
A spot inspection captures what the team finds at that moment. When an observation has no image, time or location, the manager has little to go on when reviewing it and deciding how to respond.
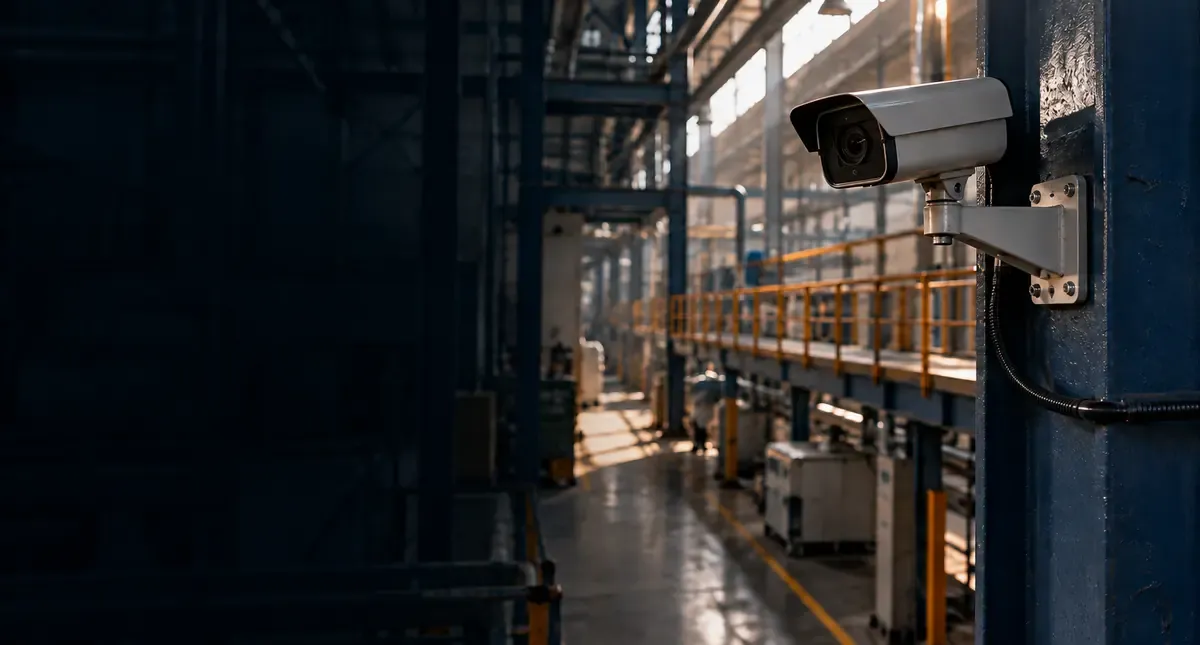
SafeWatch detects missing hard hats, high-visibility vests, gloves and earmuffs across the cameras and areas you configure. It also detects people entering restricted areas. The platform logs each violation with an image, date, time, camera and type, and sends alerts via WhatsApp and email, configured per camera.
Before deployment, we assess your area: camera position, distance, lighting and anything that might block the view of the worker. SafeWatch complements your team’s work and your engineering controls; it does not replace them.
To prepare for the conversation, pick an area, the required PPE and who should receive the alert. Contact us to assess that scope.
Data and monitoring: track the variable before discussing prediction
Readings scattered across machines, spreadsheets and systems make it hard to compare periods. An indicator with no clear source, or no one responsible for its alarm, can add to the volume of information without helping operations.
CLQuickium brings industrial data together through controllers, gateways and integrations with external systems. The platform provides real-time data collection, charts, alarms, indicators and scheduled reports, depending on the available signal and the agreed integration.
Before talking about predictive maintenance, identify the history you need, the quality of the readings and the failure you want to study. Failure prediction and energy savings don’t come automatically with a dashboard: each case requires a specific assessment.
Write down the variable, the unit, the desired frequency and what should happen when it goes out of range. Explore the CLQuickium page and contact us about data collection.
Visual inspection: test an observable criterion
A repetitive visual check can vary with the product, the lighting and the position. Until you define what an acceptable part looks like and what counts as a defect, no test can show whether automation is worth it.
Quality inspection is not a SafeWatch feature. Quickium evaluates camera-based inspection and classification as custom projects, starting with the process, the samples and the cost of a wrong call.
A hypothetical example: a packaging line wants to detect a visual difference. The first step would be to gather conforming and nonconforming samples, see how lighting changes affect the image and define how to check the camera’s decisions. It’s a possible test, not a customer case.
Bring the inspection criterion, the line speed and the part variability. Contact us to assess a process.
Computer vision project guide (Portuguese).
Legacy machines: find the signal you can pull from the equipment
A machine without a network connection may still have useful sensors and signals. When everything depends on manual readings, the team has to piece together the reading, the time and the context to reconstruct what happened.
CLQuickium connects non-networked machines through a controller and gateway. The assessment starts with the available readings: digital, analog, voltage or current signals. Not every machine or protocol is compatible, so the technical assessment comes first.
The first step is an inventory: machine model, available documentation, accessible signals and constraints on modifying the equipment. With maintenance, automation and IT at the table, that inventory lets you discuss the integration and the data that will reach the dashboard.
Contact us with one machine and one priority reading. Please don’t send confidential information in your first message.
Legacy machine integration guide (Portuguese).
Data into decisions: who acts on the record?
A record is only worth something if there’s a routine around it. Who reviews the violation? Who receives the alarm? What time period allows a useful comparison?
In SafeWatch, filterable history, the dashboard and reports support analysis. In CLQuickium, indicators and reports organize the integrated readings. The next step is to pair an operational question with a data source and an owner. Pricing is available on request. Which event or variable would you like to assess first? Contact us.